 I typically use tradition technical analysis when tracking stock price movement, with primary emphasis on Volume and Price and the MACD and MFI. These are by far the best indicators of momentum and investor sentiment. The secondary indicators I use, such as RSI and Stochastics are used for confirmation of trends.
Another such confirming indicator is Elliot Wave, based on Fibonacci ratios. These ratios are found everywhere in nature, including the behavior of men in mob situations, which the securities market is an excellent model.
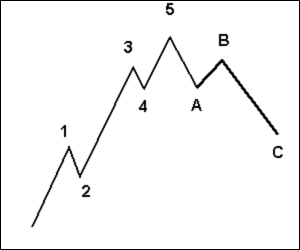
Well as you may know, advancing stocks generally follow a pattern of 5 waves up and 3 waves of correction, the corrective waves often referred to as abc waves. The ratios between these waves, more often than not, seem to follow these fibonacci ratios eerily close. And the the wave that investors are usually looking for, which has the best potential once confirmed, is the 3 wave up.
The THIRD WAVE is your Friend!
This is the wave that AAPL is currently exhibiting. Now third waves typically occur at one of 3 possible fibonacci multiples (.618, 1.618, or 2.618). Od course 2.618 is what we all hope for. Well, AAPL has logged a perfect fibonacci 1 and 2 wave, and is in the midst of a confirming 3 wave that has exceeded 1.618 (currently at 2.14). Which means in all likelihood, it should reach for the 2.618 peak. This equates to a target price of 152.55.
So, Zach's prediction is that the current AAPL 3 wave will reach $152.55 before correcting to and ABC which should put it at 142. Which will be the future 50 day EMA. Hmmmm.
Monday, March 31, 2008
AAPL Elliot Wave Forecast
-zach bass
Labels:
Technical Analysis
Subscribe to:
Post Comments (Atom)


0 comments:
Post a Comment